The main objectives of the Hot Air project were to
- build a list of most influential online actors disseminating climate change counter-narratives through social media; and
- identify the types of claims and narratives being disseminated.
To achieve these objectives, our team at Tortoise:
- Identified 274 online actors and 129,334 posts from those actors which we collated into the Hot Air tool. Our data encompasses X, YouTube, TikTok and various news websites and blogs that we identified as frequently disseminating climate change counter-narratives.
- Worked with researchers at the Centre for Climate Communication & Data Science (C3DS) to run these posts through CARDS2.0, an AI-based model which categorises a broad set of claims typically found in climate contrarian discourse.
- We then used the claims produced by CARDS to inform our own, simplified list of climate change counter-narratives, which included climate denial, climate delay, and climate control.
We provide the details of the procedures used to collect and analyse the HotAir dataset, as well as important limitations associated with the project.
Establishing a taxonomy
We defined climate change counter-narratives as falling into three broad categories:
- Climate Denial – climate change is not happening
- Climate Delay – climate change might be real, but we need to slow down roll-out of green policies
- Climate Control – climate change policies are more about controlling the public than addressing global warming
Identifying influential actors and gathering data
X
Our starting point for identifying actors on X was the community notes dataset. Taking a subset of community notes that were rated overall as “helpful”, we used a climate-related keyword query to identify initially any community notes that appeared related to climate, and then used the ClimateBERT model to filter out false positives. We then collated all the original X accounts who posted the content that was community-noted, which gave us an initial list of X accounts with posts that had been community noted on climate change related claims they had made.
We used the same climate-related keyword query to search and gather all potentially climate-related posts made by these accounts from January 2021 to September 2024. We then used these posts to expand our initial list of accounts using a social graph-based approach.
This involved identifying new users that were either frequently retweeted or replied to in posts from our initial list of accounts. From these, we took users who were retweeted or replied to by at least five different users in our original list as potential influencers. Many of the new users who were retweeted or replied to were not actually climate skeptics (for example, Greta Thunberg was often quote-tweeted by climate-sceptic actors in a critical fashion), so we manually reviewed the list of new users to identify which ones were also disseminating climate counter-narratives and being retweeted favourably by their peers.
We then gathered all relevant posts from these new users using the same method as before.
YouTube
To identify actors on YouTube, we started with the list identified by the Center for Countering Digital Hate (CCDH) in their research and with known climate content creators. All the channels were scraped to retrieve the videos posted and metadata associated with the channels (number of subscribers, creation date, handle, view count, topics etc). All of these actors’ videos during the timeframe were scraped for video-specific metadata such as view count, publication date, description and title. Only videos containing at least one keyword (appendix 1) in either the description or the title were selected and later transcribed.
TikTok
We had created a list of online profiles of climate-sceptic actors (building on work done by DeSmog and CCDH) and searching through community notes on X for conversations on climate. From this list we looked to see which actors also had TikTok accounts. We also built a list of hashtags to search to identify high activity actors in those tags (e.g. #climatehoax) to find any creators that were unique to TikTok. We then combed through each video transcript to find climate-related content, which went into our dataset. Following a similar process, each TikTok channel identified as potentially relevant was scraped to collect metadata and the videos posted. Each video was scraped and only the ones with a keyword in the description or the title would then be downloaded.
News and blogs
Through desk research we identified ten online publications as potentially relevant:
- Daily Mail
- Daily Sceptic
- Climate Depot
- CO2 Coalition
- Judith Curry’s blog
- Net Zero Watch
- The Epoch Times
- The Heartland Institute
- Spiked Online
- Watts Up With That
- Wind Watch
These online publications were among the most shared domains in the network of accounts that we had initially identified on X. Most of these websites were scraped integrally, meaning all articles published in the time window were collected.
For larger publications, i.e. the Daily Mail, the Daily Sceptic and the Epoch Times, a complete scraping was not possible due to the number of articles. Articles from these three websites were found using a SerpAPI – a Google search targeted to specific domains. With the combination of the domains and keywords specific to climate change we found articles that would later be scraped to collect the HTML, title, author name and date of publication.
Cross-referencing
After collating our list of accounts from each separate platform, we then cross-referenced users between each source. The aim of this was to
- link together different accounts/online presences maintained by a single actor (for example, Jordan Peterson’s YouTube account and X account); and
- fill in missing gaps where we had gathered data on an actor on one platform, but missed their account on another.
This involved manually searching for accounts under the same name (or very similar variants) that we’d collected for other platforms, and verifying through user biographies/descriptions for each platform that it was in fact the same person.
Where we had already collected the account, we linked them together as a single entity. Otherwise we searched for the user again on each platform, and if we found a match we gathered their content using the same methods for each platform described above.
Preparing the data for analysis
X
For X posts, we kept the text of the post as it originally appeared. We excluded any media (images and video) that was included with the post from our analysis.
YouTube
Transcripts were obtained from each YouTube video through a Python library using their unique IDs. The result did not contain punctuation, so it was passed to an LLM, which “guessed” where the sentences were and added punctuation to the initial transcript.
TikTok
Each video was downloaded and stored locally to extract the corresponding sound file. The sound files were transcribed using the OpenAI Whisper model.
Chunking
As long pieces of text cannot be ingested and categorised by the different AI systems we used we had to split them into smaller bits called chunks. Each paragraph would become a chunk in an attempt to keep the original structure and be as close to the original meaning as possible.
Identifying climate change counter-narratives
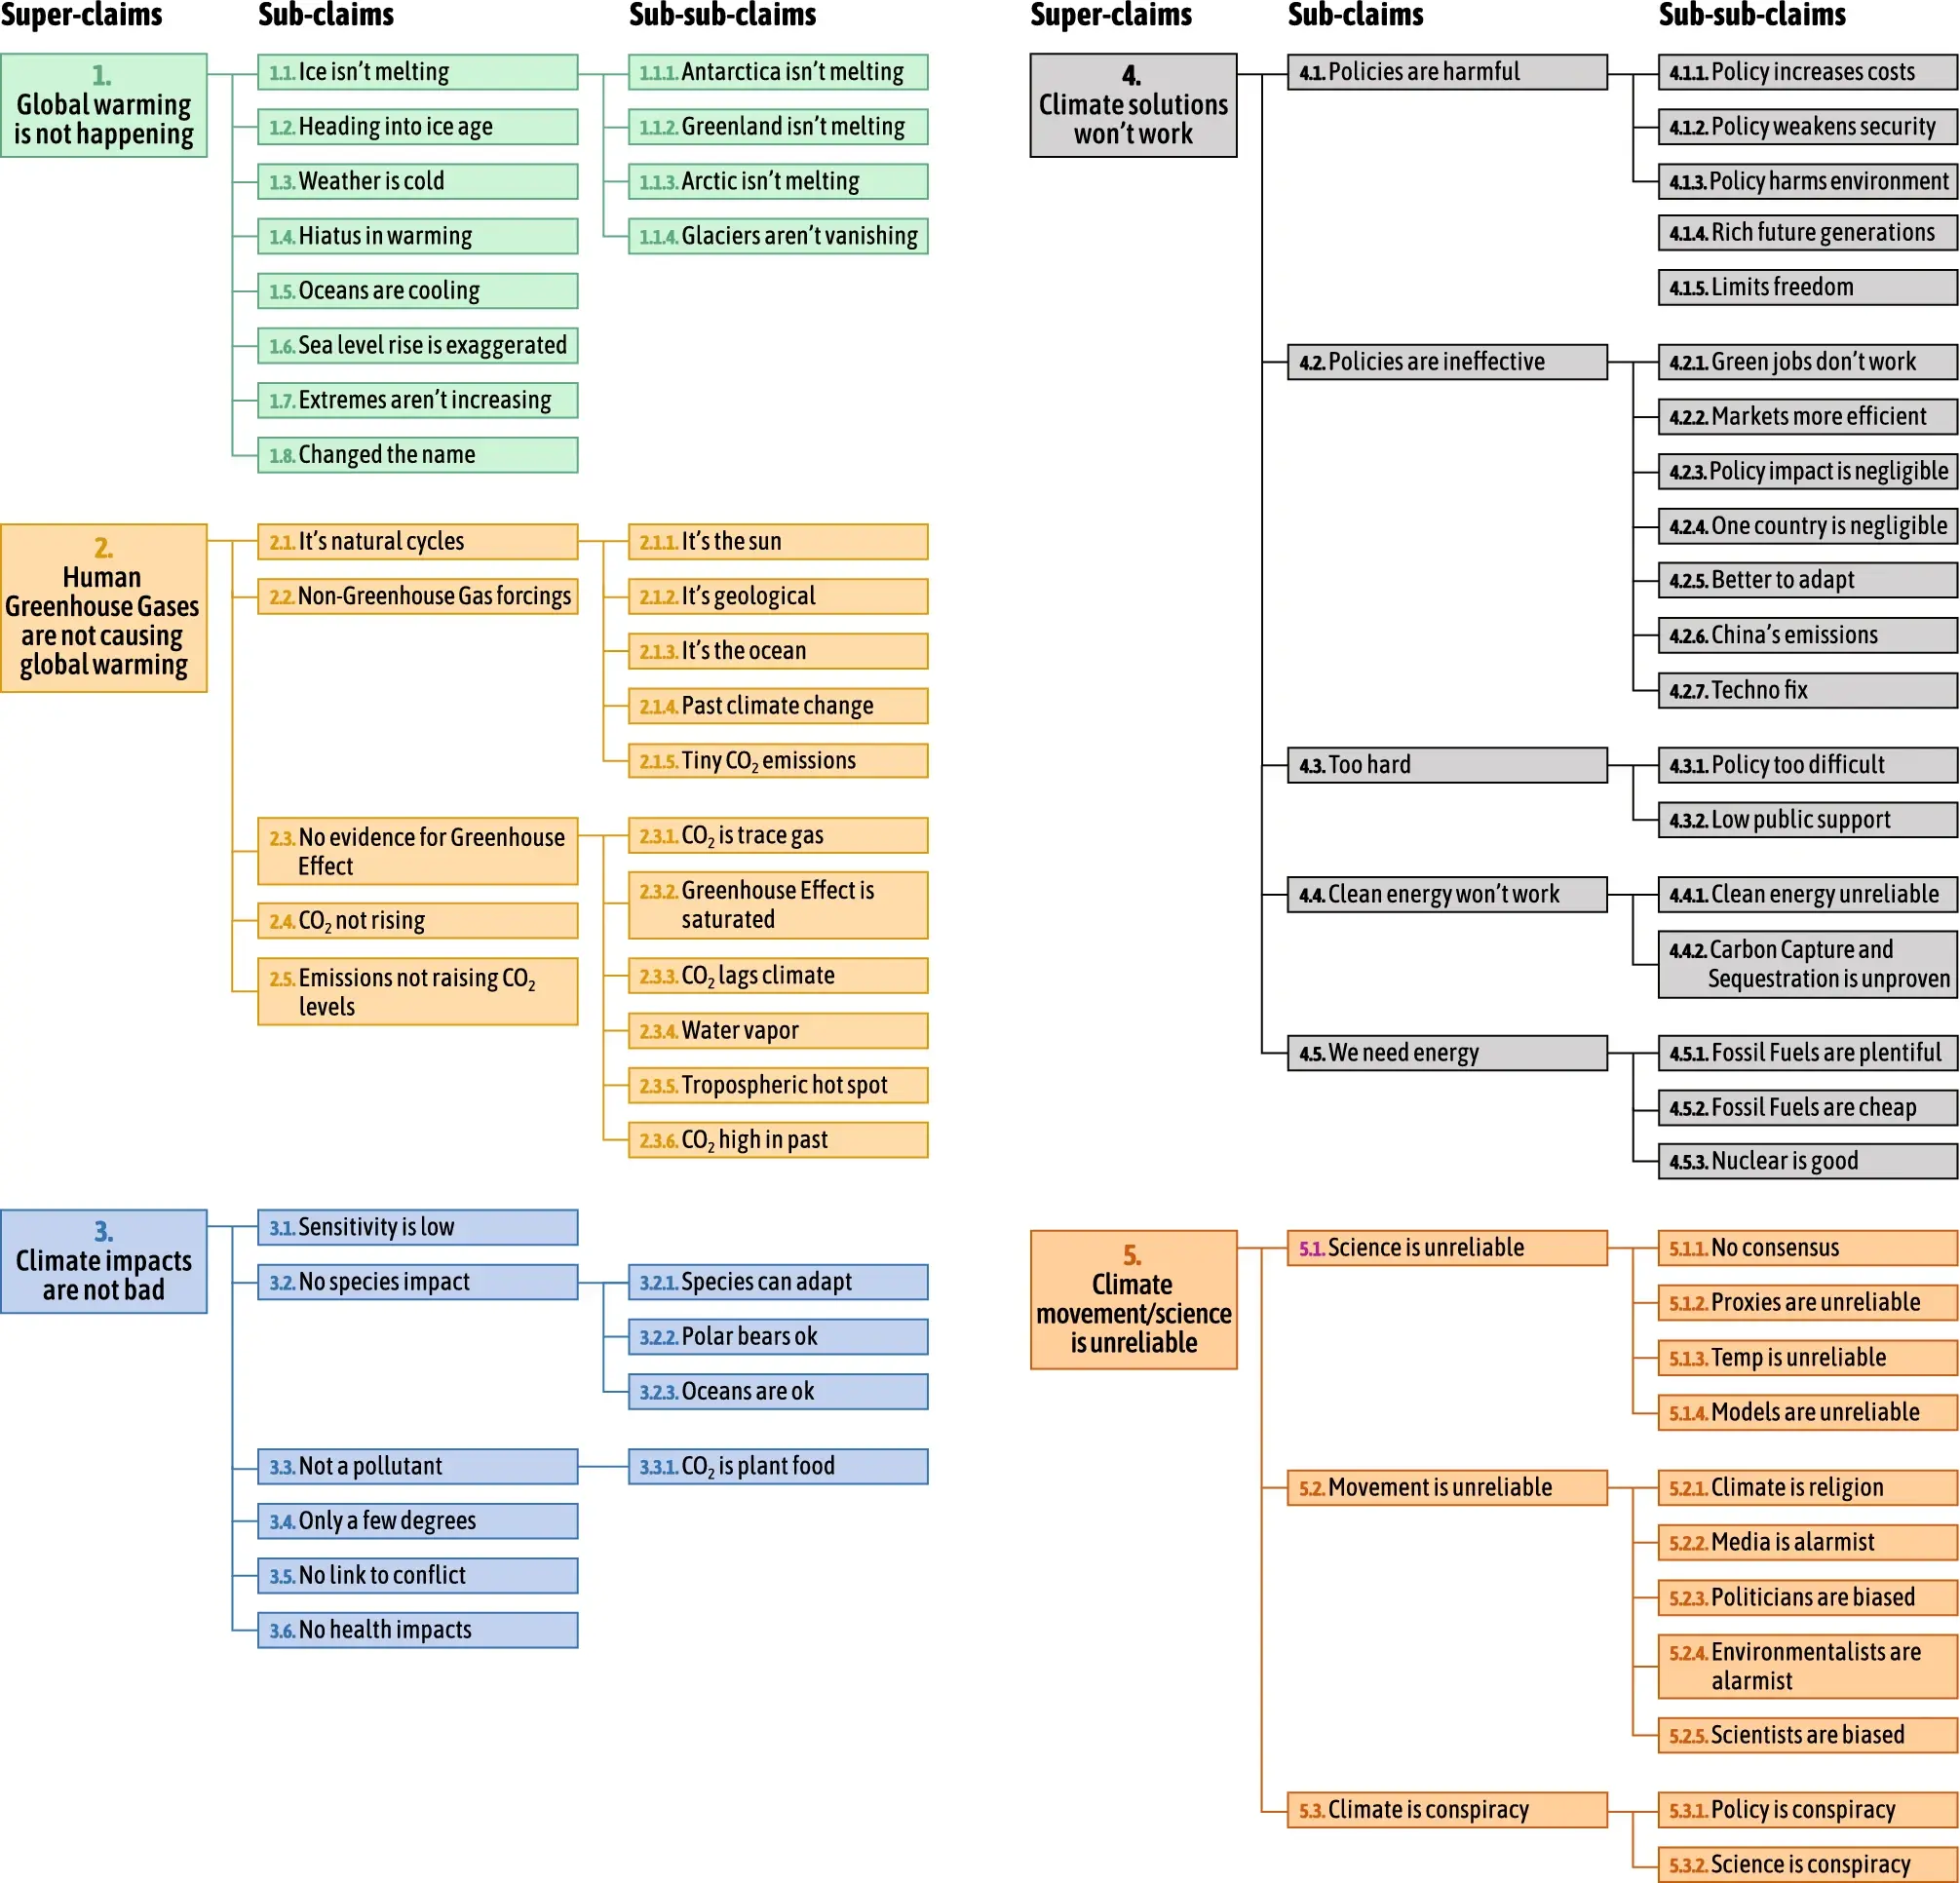
We implemented a two-step procedure to identify and classify key counter-narratives. We started by analysing our data using the CARDS2.0 (Computer-Assisted Recognition of Denial and Skepticism) model. The model was developed by Travis Coan, Ranadheer Malla, and Mirjam Nanko at the Centre for Climate Communication and Data Science at the University of Exeter, John Cook at the University of Melbourne, and Constantine Boussalis at Trinity College Dublin. The CARDS2 LLM-based AI system reviews text related to climate change and identifies if the text contains any claims that match a detailed, hierarchically organized taxonomy of common climate change counter-narratives (see appendix 2). The CARDS2 model organises relevant claims under one of the following "super claim" headings: 1) climate change isn't happening, 2) humans aren't causing climate change, 3) climate change won't be bad and may even be good, 4) climate change solutions won't work, 5) climate science is biased, 6) scientists and proponents of climate action are alarmist or corrupt, and 7) society needs fossil fuels. For more information and access to CARDS2, visit https://chat.cardsclimate.org/.
Next, we use the claims produced by the CARDS2.0 system to inform the categorisation of posts into our three counter-narratives of interest: climate change denial, delay, and control. We do so by identifying claims in the CARDS taxonomy that tend to be associated with these broad narratives. While there is not a perfect map from the CARDS claims to our counter-narratives, the CARDS2.0 model gives us a good indication of which posts are likely be associated with each narrative.
In an attempt to minimise the impact of inaccurate results produced by the CARDS model, we measured the uncertainty, or “perplexity”, of each model response, with perplexity defined as the model’s overall confidence in its result – a higher perplexity indicates the model is less confident in its analysis, and the risk of inaccurate classification is higher.
There are various approaches to uncertainty-based heuristics for LLMs. For this project we used the fairly simple methodology of calculating perplexity by summing the individual log probabilities of each relevant output token in the model response, as outlined in OpenAI’s guide to using logprobs. In our case, the CARDS2 classification used a chain-of-thought process to analyse and classify the text, so we took the log probabilities of the tokens where a taxonomy label was first assigned (e.g. “<5_3_1>”) to calculate a perplexity score per individual classification.
Checking model accuracy
Although it’s been found that the model would not classify a piece of content that is not related to climate change, we found occurrences of model outputs that were not.
We also found that with refined keyword searches (with specific phrases such as “climate alarmist” and “climate propaganda”) we could identify segments that are very likely to be about climate scepticism. Combined with the number of keywords (appendix 1) in each piece of content and their perplexity, we analysed their relevance to this project. This allowed us to end up with a small subset which was manually reviewed. This resulted in 0.8 per cent of the dataset to be discarded. Although more false positives could remain in the dataset, random spotchecks did not reveal any.
Selecting a final shortlist
We filtered out any actors that had fewer than ten pieces of content across our platforms, to focus on actors who were consistently producing content. We also filtered out any posts that were initially flagged as misinformation but were either merely reporting on the existence of the misinformation or refuting it. This process was mostly done manually.
The measure of the reach of each platform
For YouTube and TikTok the reach of a video is the number of times it’s been viewed. For all news websites and blogs the reach was inferred from the organic traffic of the website on the month of the publication.
Images
In the case of YouTube, the thumbnail is available in the API response and publicly accessible. Similarly for X, the images are part of the text and could be downloaded directly. The images coming from all other platforms were extracted using automated screenshots. They were all pre-processed to have a consistent format and equivalent quality. In an attempt to ensure that the images were fit to be published they went through a detector of explicit content. The images that were flagged were then reviewed manually and some of them were removed from the dataset.
Data cleaning
To avoid publishing slurs each piece of content was run through a slur detection algorithm. Words identified as slurs were obfuscated using the star symbol (*) to replace all their letters except for the first and last.
Custom topics
A topic was associated with each piece of content using BERTopic, a topic modelling technique based on transformer embeddings. The results were manually reviewed and processed to aggregate them into groups that would then be used to create the stories associated with the tool.
Limitations
Due to the volume of data processed it is possible that the scraping of some videos or users was incomplete. This would result in the dataset being less comprehensive than intended.
The same goes for transcripts of videos, as the sound quality or other factors would sometimes prevent the transcription algorithm from performing properly, the transcripts would not be extracted and therefore would be absent from the dataset.
The identification of climate-related content with ClimateBERT was done using thresholds we found to be optimal. Although minimal, this resulted in discarding relevant pieces of content.
Content of each post, including reach metrics such as likes, views, and reposts, is accurate at the time of scraping, and may have changed or been edited since then. Content may have been deleted since the data was gathered, but we will keep content in our dataset regardless, as we are providing a snapshot in time.
Appendix 1
alarmism
alarmist
antarctica
atmosphere
biodiversity
biomass
carbon
climate
climategate
CO2
coal
combustion
cooling
COP
coral
diesel
disaster
drought
earth
earthquake
electric
emissions
energy
environment
environmental
environmentalist
eruption
evs
extinction
floods
forecast
fossil
fracking
fuel
gas
geothermal
glaciers
green
greenhouse
greenland
greta
heat
hurricane
hydroelectricity
hydropower
ice
lithium
methane
net
nuclear
oil
planet
plants
polar
pole
pollution
recycling
renewable
solar
storm
temperature
turbines
volcano
warming
weather
wildfire
wind
windmills
Appendix 2
The tool was developed in consultation with the Centre for Climate Communication & Data Science (C3DS) and supported by Octopus Energy
For further information about the tool, please send queries to data.graphics@tortoisemedia.com